Previous entries have done well in discussing how the previous Crop Stop 1.0 is being used as a tool to build upon for a new iteration being referred to as Crop Stop 2.0. One goal for the new iteration is to consider how the structure can assist farmers in processing and packaging produce not only in Charleston but also throughout the United States. The goal for the project is not necessarily to create one model that works in all regions, but investigating how a standard model may begin to adapt to various climates through strategies that have yet to be defined. These changes could include concepts such as building techniques, site orientation, and materiality.
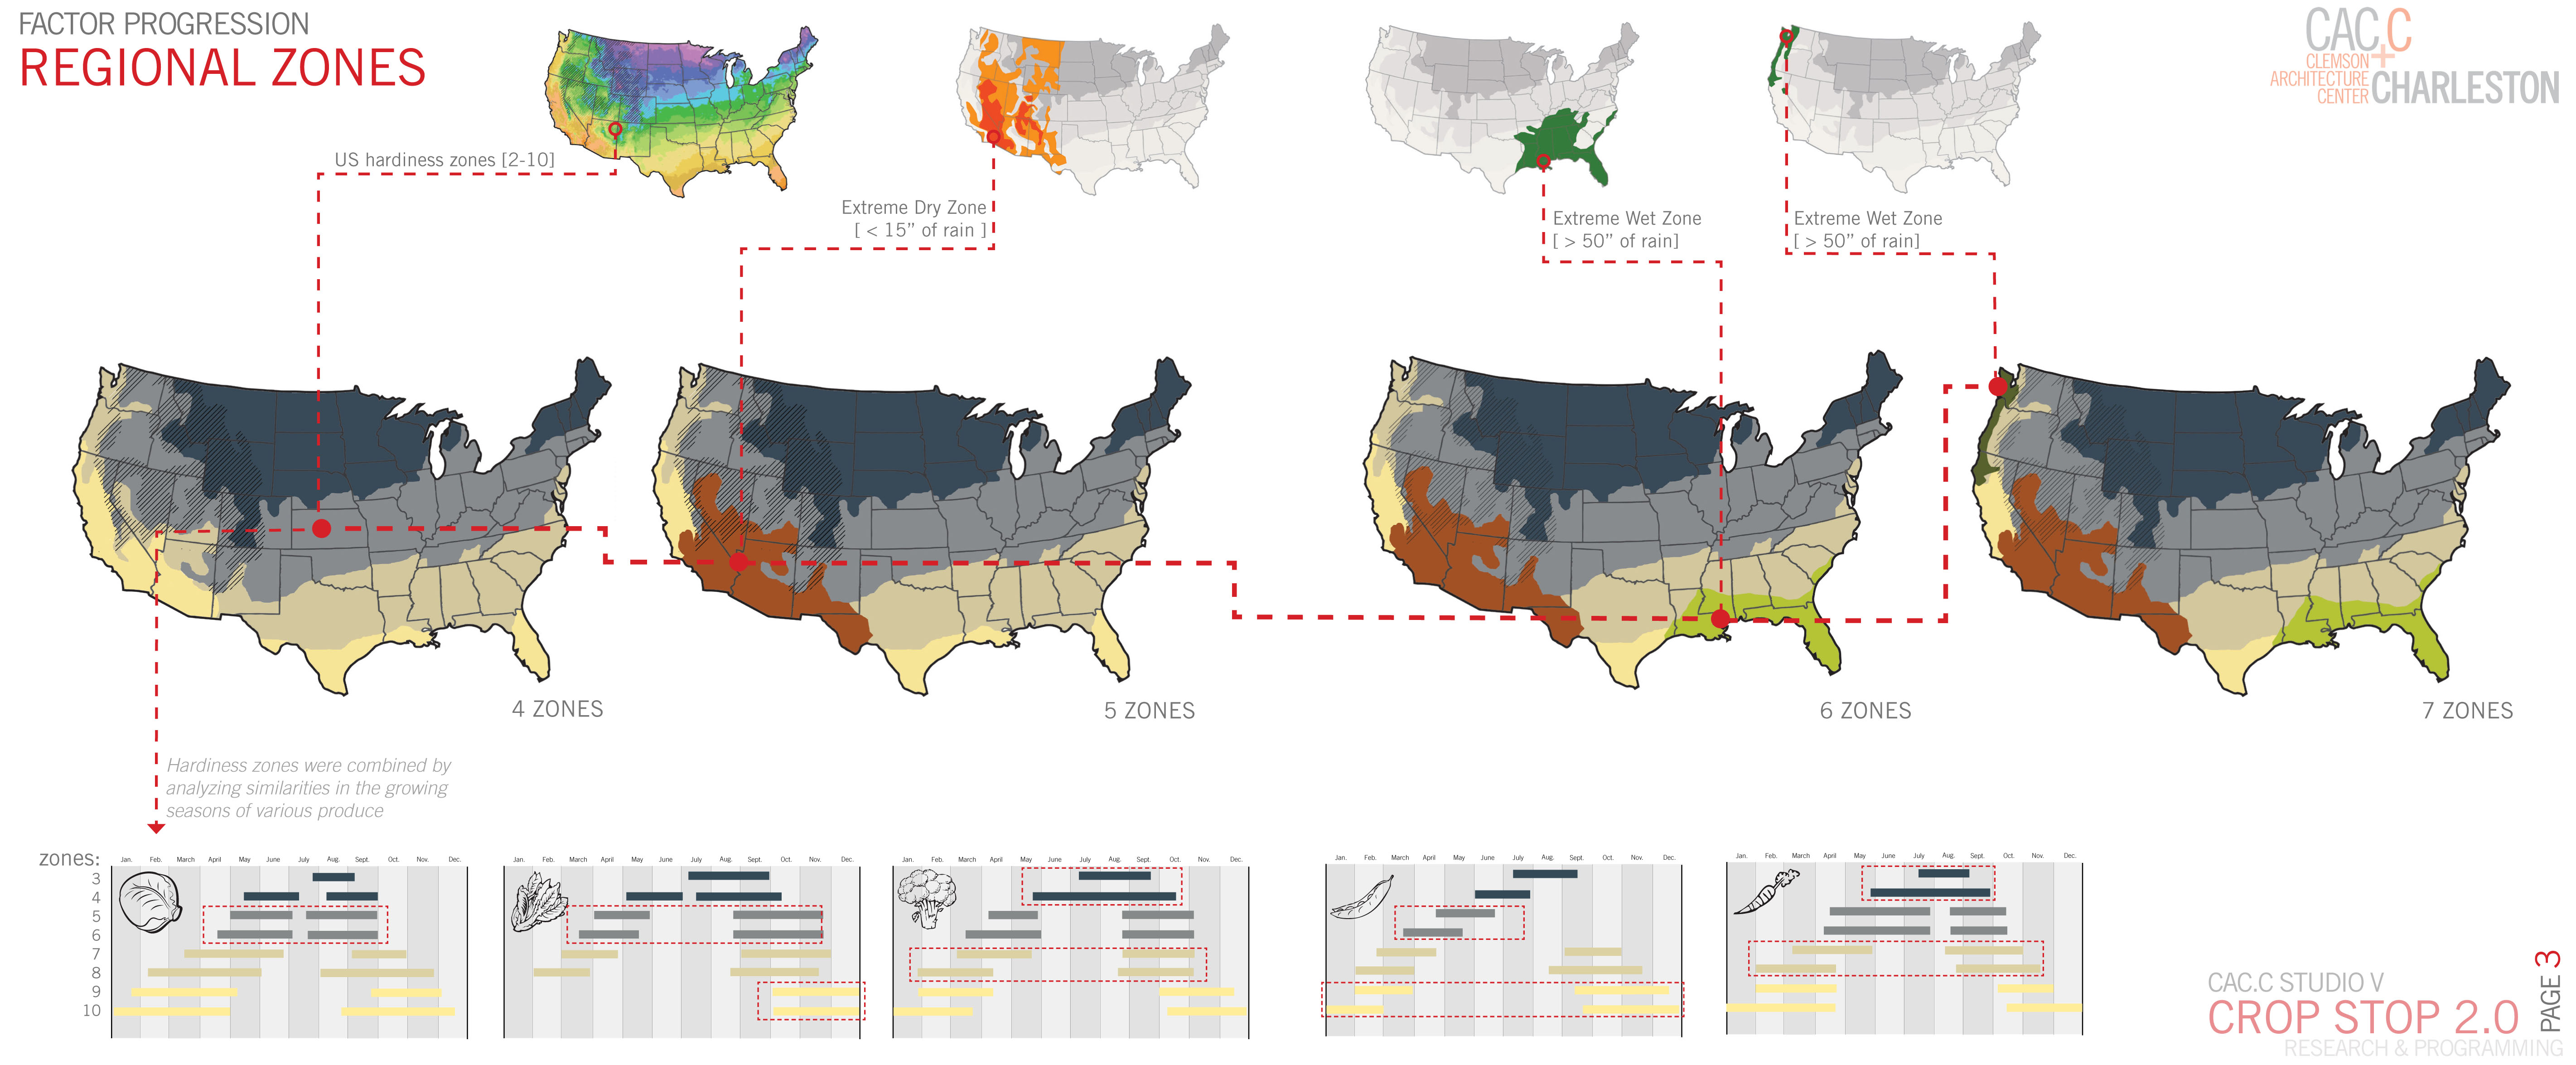
While we want to make the Crop Stop accessible to the entire country, we do not want to ignore regional influences on design as well as growing and harvesting schedules. To account for variation throughout the US, we broke down the country into seven regions. Combining similar plant hardiness zones and overlaying data from average recorded precipitation to create extreme wet and dry zones led to our interpretation of seven unique regions.
 http://planthardiness.ars.usda.gov/PHZMWeb/Default.aspx
“The 2012 USDA Plant Hardiness Zone Map is the standard by which gardeners and growers can determine which plants are most likely to thrive at a location. The map is based on the average annual minimum winter temperature, divided into 10-degree F zones.” (USDA Agricultural Research Service)
This method of delineation is a direct response to human comfort levels as well as what crops will be growing and when. The regions serve as a recommendation to how the Crop Stop 2.0 could be designed with overarching concepts that could be transformed to better serve local communities and the farmers who will be occupying the facility.